
Oct 2, 2026
By Victor Teran
What Is a Good Free Trial to Paid Conversion Rate? 10% Without a Card Is Great
Without a credit card, converting 10 to 15% of free trials to paid is great and 4 to 6% is merely good. The trial model sets that ceiling. Where you land under it depends on how many users reach value before the clock runs out.
Activation
Benchmarks
Conversion
A B2B free trial with no card required converts 4 to 6% of signups to paid at a good company and 10 to 15% at a great one. Ask for the card upfront and good becomes 25 to 35% (ChartMogul, 2026). Those two ranges are the yardstick.
The standard advice is to fiddle with the trial: shorten it, lengthen it, add a card, remove the card. Those levers are real, and they are also the smallest ones. A trial is a countdown. The question it answers is whether a new user reached the thing your product is for before the countdown ended. Fix that and the conversion rate follows.
Key takeaways
In ChartMogul's 2026 survey of 200 B2B software products, a good free-to-paid rate is 4 to 6% for trials without a card and 25 to 35% with one; great is 10 to 15% and 50 to 60%.
Trial to paid conversion rate equals trials that became paying customers divided by trials started in the same cohort. It is also, by arithmetic, in-trial activation rate multiplied by the paid rate among activated trials.
Requiring a card raises the conversion rate and cuts signups. On First Page Sage's averages, 1,000 organic visitors produce about 15 customers on an opt-in trial and about 12 on an opt-out one.
Trial conversion is mostly an activation problem. Users who never reach the value moment inside the trial have nothing to pay for, and in RevenueCat's 2026 data 55% of cancellations on 3-day trials happen on Day 0.
How do you calculate free trial to paid conversion rate?
Take everyone who started a trial in a given period, count how many became paying customers, and divide.
Trial to paid conversion rate = paying customers from the cohort ÷ trials started in the cohort × 100
Cohort in, cohort out. Count the trials that started in March and follow those same people to payment, however long your trial runs. A blended number (all conversions this month over all trials this month) mixes cohorts and hides whether last month's change did anything.
Then split it in two, because this is where the formula earns its keep:
Trial to paid = (activated trials ÷ trials started) × (paying customers ÷ activated trials)
The first term is your in-trial activation rate. The second is how well you convert people who already got value. Almost every conversion tactic on the internet works on the second term. At median activation, the first term loses 62 of every 100 trials before the second term gets a vote.
What is a good free trial to paid conversion rate by trial type?
Without a card, 10% is great. With a card, 25 to 35% is only good. Freemium is good at 3 to 5%.
Trial type | Source and population | Benchmark |
|---|---|---|
Opt-in trial, no card | ChartMogul, 200 B2B software products, surveyed January 2026 | Good 4 to 6%, great 10 to 15% |
Opt-in trial, no card | First Page Sage, 86 SaaS clients (71% B2B), Q1 2022 to Q3 2025 | 18.2% organic, 17.4% paid traffic |
Opt-out trial, card required | ChartMogul, same survey | Good 25 to 35%, great 50 to 60% |
Opt-out trial, card required | First Page Sage, same dataset | 48.8% organic, 51% paid traffic |
Freemium | ChartMogul, same survey | Good 3 to 5%, great 8 to 12% |
Freemium | First Page Sage, same dataset | 2.6% organic, 2.8% paid traffic |
Consumer app trials | RevenueCat, 115,000+ apps, State of Subscription Apps 2026 | Median 25.5% for trials of 4 days or less, 42.5% for 17 to 32 days |
Sources: ChartMogul SaaS Conversion Report (February 2026), First Page Sage (September 2025), RevenueCat (2026).
Two sources, two very different opt-in numbers, and the gap is definitional. ChartMogul counts leads or free signups that become paying customers within six months. First Page Sage aggregates its own agency's clients and counts a conversion as even a single paid month. Pick one yardstick, match its definition, and stop comparing your number against a blend of both.
The RevenueCat row is mobile subscription apps, not B2B SaaS. It belongs here for one reason we will get to: it shows exactly when trials are lost.
FREE GUIDE
The 4 product leaks costing you growth
A short audit guide for founders. Find the four places your product leaks revenue, and what to fix first.
Should you require a credit card for your free trial?
Only if you want a higher rate and can live with fewer signups, because on average you get both.
The card-required number looks like a cheat code. It is a filter. First Page Sage puts organic visitor-to-trial at 8.5% for opt-in trials and 2.5% for opt-out ones. Run 1,000 organic visitors through each:
Opt-in: 85 trials at 18.2% = about 15 paying customers
Opt-out: 25 trials at 48.8% = about 12 paying customers
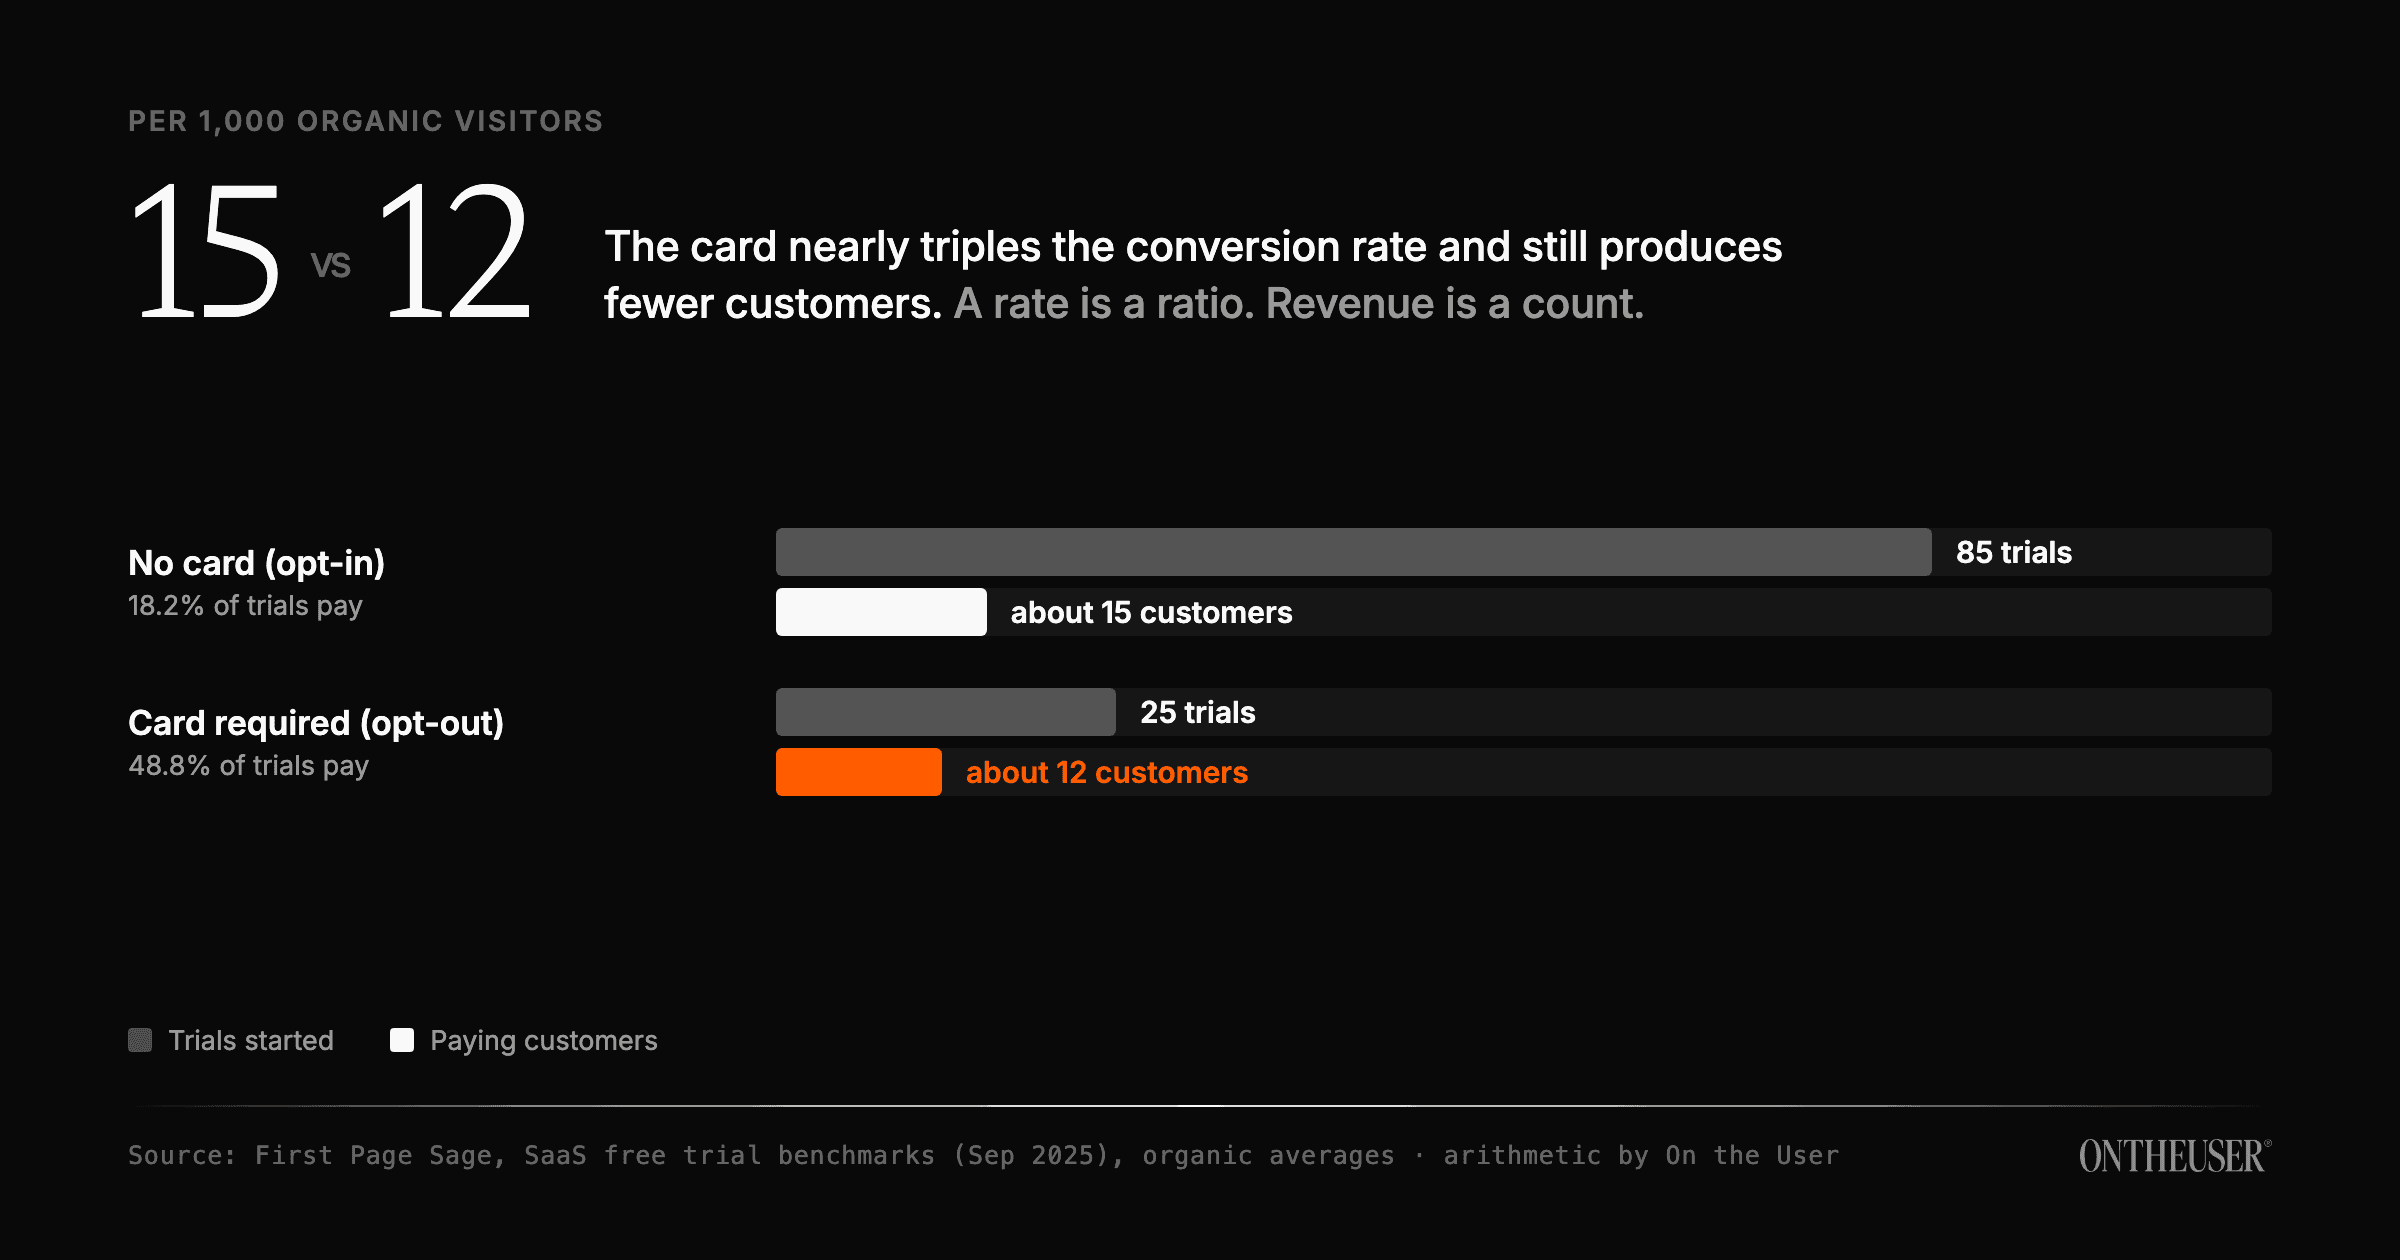
Arithmetic on First Page Sage's organic averages (September 2025): visitor to trial, then trial to paid.
The card nearly tripled the conversion rate and produced fewer customers. ChartMogul found the same shape one level up: free trials convert slightly better than freemium, and the difference gets wiped out once you account for signup rates. The conversion rate is a ratio. Your bank account is a count.
There is a second catch. On First Page Sage's definition, a card-required trial that auto-renews into one paid month and then cancels counts as a win. That is conversion on paper and churn in practice.
So the card is a pricing decision, not a fix. If your trial converts badly without one, adding it hides the problem behind a smaller denominator.
Why do most free trials fail to convert?
Because trial users who never reach the value moment before the trial ends have nothing to pay for, and at median activation that is most of them.
Median B2B SaaS activation is 38% (Perspective AI, 2026). Put that into the decomposition. If 38% of your trials reach activation and a quarter of those pay, you are converting 9.5%. You can spend a year polishing the paywall, the pricing page and the day-12 reminder email, and all of that work touches the 38%. The other 62% never saw anything worth paying for.
RevenueCat's 2026 report puts a clock on it. For 3-day trials, 55% of cancellations happen on Day 0. RevenueCat's own reading is that the subscriber is won or lost in the first session. That is consumer mobile data, and B2B trials run longer, but the mechanism is the same: the trial length you designed is not the trial length the user gives you.
This is also why trial length is a weaker lever than it looks. RevenueCat's longer trials do convert better (42.5% median against 25.5%), yet the decision still forms early. A longer trial gives a lost user more days to stay lost. It does not show them the value.
ChartMogul's second 2026 report lists faster time to value as a focus area and names the gap underneath it (ChartMogul, March 2026): product activation is owned by the product team 49% of the time, yet few of those teams are accountable for free-to-paid conversion. The people who own the lever are not measured on the number.
What does fixing activation do to trial conversion?
If the paid rate among activated users holds, trial conversion moves in direct proportion to activation.
That is arithmetic, not a promise, and it is the most useful sentence in this post. Here is what it looks like with numbers from a real engagement.
Q.AI came to us with a growing user base and a retention curve nobody could explain. We built a funnel over the new-user path in Amplitude, watched session replays of the users who dropped at the worst step, and redesigned only the screens the data implicated. Activation went from 38% to 67%, onboarding completion rose 68%, and support tickets fell 73%. No new features. Q.AI was later acquired by Forbes.
We did not publish a trial conversion figure for Q.AI, and we will not invent one. But run that activation move through the formula as an illustration. Assume 1,000 trials a month, a paid rate of 20% among activated trials, and $100 a month average revenue per account. All three are assumptions, labeled as such.
Illustrative, 1,000 trials a month | 38% in-trial activation | 67% in-trial activation |
|---|---|---|
Activated trials | 380 | 670 |
Paying customers (20% of activated) | 76 | 134 |
Trial to paid conversion rate | 7.6% | 13.4% |
New MRR from the cohort at $100 ARPA | $7,600 | $13,400 |
Same traffic, same pricing, same paywall. Conversion goes from "good" to "great" on ChartMogul's no-card scale, and each monthly cohort brings in $5,800 more MRR. That is $69,600 a year from one month of trials, before churn, and the same gain lands again every month after.
Compare that with the card-required switch above, which raised the rate and lost three customers per 1,000 visitors.
How do you find where your trial users drop off?
Define the activation event, measure how many trials reach it inside the window, then watch the ones who did not.
The order matters more than the tools.
Write your activation event in one sentence. Not signup, not email verified, not "completed the tour". The first moment a user experiences the core value (Amplitude). If you cannot write it, start with how to define your activation event.
Measure in-trial activation by cohort. Trials started this week, share that reached the event before the trial ended. Compare it with the activation benchmark: median B2B SaaS is 38%.
Split your conversion rate with the formula. If activated trials pay at a healthy rate and the overall number is still low, your problem is the first term, and your pricing page is innocent.
Watch session replays of trials that never activated. Filter to the step where the funnel falls hardest. The reason is usually boring: effort asked before value was shown, or a next step nobody could find.
Change only what the evidence points at, and measure on the same funnel, new trial cohorts against old.
At no step do you touch the trial length or the card. Those are real decisions. Make them after you know how many of your trial users ever saw the product work, because that number decides whether any other change can matter.
WHAT NEXT
Want this fixed in your product, not just explained?



Oct 2, 2026
By Victor Teran
What Is a Good Free Trial to Paid Conversion Rate? 10% Without a Card Is Great
Without a credit card, converting 10 to 15% of free trials to paid is great and 4 to 6% is merely good. The trial model sets that ceiling. Where you land under it depends on how many users reach value before the clock runs out.
Activation
Benchmarks
Conversion
A B2B free trial with no card required converts 4 to 6% of signups to paid at a good company and 10 to 15% at a great one. Ask for the card upfront and good becomes 25 to 35% (ChartMogul, 2026). Those two ranges are the yardstick.
The standard advice is to fiddle with the trial: shorten it, lengthen it, add a card, remove the card. Those levers are real, and they are also the smallest ones. A trial is a countdown. The question it answers is whether a new user reached the thing your product is for before the countdown ended. Fix that and the conversion rate follows.
Key takeaways
In ChartMogul's 2026 survey of 200 B2B software products, a good free-to-paid rate is 4 to 6% for trials without a card and 25 to 35% with one; great is 10 to 15% and 50 to 60%.
Trial to paid conversion rate equals trials that became paying customers divided by trials started in the same cohort. It is also, by arithmetic, in-trial activation rate multiplied by the paid rate among activated trials.
Requiring a card raises the conversion rate and cuts signups. On First Page Sage's averages, 1,000 organic visitors produce about 15 customers on an opt-in trial and about 12 on an opt-out one.
Trial conversion is mostly an activation problem. Users who never reach the value moment inside the trial have nothing to pay for, and in RevenueCat's 2026 data 55% of cancellations on 3-day trials happen on Day 0.
How do you calculate free trial to paid conversion rate?
Take everyone who started a trial in a given period, count how many became paying customers, and divide.
Trial to paid conversion rate = paying customers from the cohort ÷ trials started in the cohort × 100
Cohort in, cohort out. Count the trials that started in March and follow those same people to payment, however long your trial runs. A blended number (all conversions this month over all trials this month) mixes cohorts and hides whether last month's change did anything.
Then split it in two, because this is where the formula earns its keep:
Trial to paid = (activated trials ÷ trials started) × (paying customers ÷ activated trials)
The first term is your in-trial activation rate. The second is how well you convert people who already got value. Almost every conversion tactic on the internet works on the second term. At median activation, the first term loses 62 of every 100 trials before the second term gets a vote.
What is a good free trial to paid conversion rate by trial type?
Without a card, 10% is great. With a card, 25 to 35% is only good. Freemium is good at 3 to 5%.
Trial type | Source and population | Benchmark |
|---|---|---|
Opt-in trial, no card | ChartMogul, 200 B2B software products, surveyed January 2026 | Good 4 to 6%, great 10 to 15% |
Opt-in trial, no card | First Page Sage, 86 SaaS clients (71% B2B), Q1 2022 to Q3 2025 | 18.2% organic, 17.4% paid traffic |
Opt-out trial, card required | ChartMogul, same survey | Good 25 to 35%, great 50 to 60% |
Opt-out trial, card required | First Page Sage, same dataset | 48.8% organic, 51% paid traffic |
Freemium | ChartMogul, same survey | Good 3 to 5%, great 8 to 12% |
Freemium | First Page Sage, same dataset | 2.6% organic, 2.8% paid traffic |
Consumer app trials | RevenueCat, 115,000+ apps, State of Subscription Apps 2026 | Median 25.5% for trials of 4 days or less, 42.5% for 17 to 32 days |
Sources: ChartMogul SaaS Conversion Report (February 2026), First Page Sage (September 2025), RevenueCat (2026).
Two sources, two very different opt-in numbers, and the gap is definitional. ChartMogul counts leads or free signups that become paying customers within six months. First Page Sage aggregates its own agency's clients and counts a conversion as even a single paid month. Pick one yardstick, match its definition, and stop comparing your number against a blend of both.
The RevenueCat row is mobile subscription apps, not B2B SaaS. It belongs here for one reason we will get to: it shows exactly when trials are lost.
FREE GUIDE
The 4 product leaks costing you growth
A short audit guide for founders. Find the four places your product leaks revenue, and what to fix first.
Should you require a credit card for your free trial?
Only if you want a higher rate and can live with fewer signups, because on average you get both.
The card-required number looks like a cheat code. It is a filter. First Page Sage puts organic visitor-to-trial at 8.5% for opt-in trials and 2.5% for opt-out ones. Run 1,000 organic visitors through each:
Opt-in: 85 trials at 18.2% = about 15 paying customers
Opt-out: 25 trials at 48.8% = about 12 paying customers
Arithmetic on First Page Sage's organic averages (September 2025): visitor to trial, then trial to paid.
The card nearly tripled the conversion rate and produced fewer customers. ChartMogul found the same shape one level up: free trials convert slightly better than freemium, and the difference gets wiped out once you account for signup rates. The conversion rate is a ratio. Your bank account is a count.
There is a second catch. On First Page Sage's definition, a card-required trial that auto-renews into one paid month and then cancels counts as a win. That is conversion on paper and churn in practice.
So the card is a pricing decision, not a fix. If your trial converts badly without one, adding it hides the problem behind a smaller denominator.
Why do most free trials fail to convert?
Because trial users who never reach the value moment before the trial ends have nothing to pay for, and at median activation that is most of them.
Median B2B SaaS activation is 38% (Perspective AI, 2026). Put that into the decomposition. If 38% of your trials reach activation and a quarter of those pay, you are converting 9.5%. You can spend a year polishing the paywall, the pricing page and the day-12 reminder email, and all of that work touches the 38%. The other 62% never saw anything worth paying for.
RevenueCat's 2026 report puts a clock on it. For 3-day trials, 55% of cancellations happen on Day 0. RevenueCat's own reading is that the subscriber is won or lost in the first session. That is consumer mobile data, and B2B trials run longer, but the mechanism is the same: the trial length you designed is not the trial length the user gives you.
This is also why trial length is a weaker lever than it looks. RevenueCat's longer trials do convert better (42.5% median against 25.5%), yet the decision still forms early. A longer trial gives a lost user more days to stay lost. It does not show them the value.
ChartMogul's second 2026 report lists faster time to value as a focus area and names the gap underneath it (ChartMogul, March 2026): product activation is owned by the product team 49% of the time, yet few of those teams are accountable for free-to-paid conversion. The people who own the lever are not measured on the number.
What does fixing activation do to trial conversion?
If the paid rate among activated users holds, trial conversion moves in direct proportion to activation.
That is arithmetic, not a promise, and it is the most useful sentence in this post. Here is what it looks like with numbers from a real engagement.
Q.AI came to us with a growing user base and a retention curve nobody could explain. We built a funnel over the new-user path in Amplitude, watched session replays of the users who dropped at the worst step, and redesigned only the screens the data implicated. Activation went from 38% to 67%, onboarding completion rose 68%, and support tickets fell 73%. No new features. Q.AI was later acquired by Forbes.
We did not publish a trial conversion figure for Q.AI, and we will not invent one. But run that activation move through the formula as an illustration. Assume 1,000 trials a month, a paid rate of 20% among activated trials, and $100 a month average revenue per account. All three are assumptions, labeled as such.
Illustrative, 1,000 trials a month | 38% in-trial activation | 67% in-trial activation |
|---|---|---|
Activated trials | 380 | 670 |
Paying customers (20% of activated) | 76 | 134 |
Trial to paid conversion rate | 7.6% | 13.4% |
New MRR from the cohort at $100 ARPA | $7,600 | $13,400 |
Same traffic, same pricing, same paywall. Conversion goes from "good" to "great" on ChartMogul's no-card scale, and each monthly cohort brings in $5,800 more MRR. That is $69,600 a year from one month of trials, before churn, and the same gain lands again every month after.
Compare that with the card-required switch above, which raised the rate and lost three customers per 1,000 visitors.
How do you find where your trial users drop off?
Define the activation event, measure how many trials reach it inside the window, then watch the ones who did not.
The order matters more than the tools.
Write your activation event in one sentence. Not signup, not email verified, not "completed the tour". The first moment a user experiences the core value (Amplitude). If you cannot write it, start with how to define your activation event.
Measure in-trial activation by cohort. Trials started this week, share that reached the event before the trial ended. Compare it with the activation benchmark: median B2B SaaS is 38%.
Split your conversion rate with the formula. If activated trials pay at a healthy rate and the overall number is still low, your problem is the first term, and your pricing page is innocent.
Watch session replays of trials that never activated. Filter to the step where the funnel falls hardest. The reason is usually boring: effort asked before value was shown, or a next step nobody could find.
Change only what the evidence points at, and measure on the same funnel, new trial cohorts against old.
At no step do you touch the trial length or the card. Those are real decisions. Make them after you know how many of your trial users ever saw the product work, because that number decides whether any other change can matter.
WHAT NEXT
Want this fixed in your product, not just explained?
Oct 2, 2026
By Victor Teran
What Is a Good Free Trial to Paid Conversion Rate? 10% Without a Card Is Great
Without a credit card, converting 10 to 15% of free trials to paid is great and 4 to 6% is merely good. The trial model sets that ceiling. Where you land under it depends on how many users reach value before the clock runs out.
Activation
Benchmarks
Conversion
A B2B free trial with no card required converts 4 to 6% of signups to paid at a good company and 10 to 15% at a great one. Ask for the card upfront and good becomes 25 to 35% (ChartMogul, 2026). Those two ranges are the yardstick.
The standard advice is to fiddle with the trial: shorten it, lengthen it, add a card, remove the card. Those levers are real, and they are also the smallest ones. A trial is a countdown. The question it answers is whether a new user reached the thing your product is for before the countdown ended. Fix that and the conversion rate follows.
Key takeaways
In ChartMogul's 2026 survey of 200 B2B software products, a good free-to-paid rate is 4 to 6% for trials without a card and 25 to 35% with one; great is 10 to 15% and 50 to 60%.
Trial to paid conversion rate equals trials that became paying customers divided by trials started in the same cohort. It is also, by arithmetic, in-trial activation rate multiplied by the paid rate among activated trials.
Requiring a card raises the conversion rate and cuts signups. On First Page Sage's averages, 1,000 organic visitors produce about 15 customers on an opt-in trial and about 12 on an opt-out one.
Trial conversion is mostly an activation problem. Users who never reach the value moment inside the trial have nothing to pay for, and in RevenueCat's 2026 data 55% of cancellations on 3-day trials happen on Day 0.
How do you calculate free trial to paid conversion rate?
Take everyone who started a trial in a given period, count how many became paying customers, and divide.
Trial to paid conversion rate = paying customers from the cohort ÷ trials started in the cohort × 100
Cohort in, cohort out. Count the trials that started in March and follow those same people to payment, however long your trial runs. A blended number (all conversions this month over all trials this month) mixes cohorts and hides whether last month's change did anything.
Then split it in two, because this is where the formula earns its keep:
Trial to paid = (activated trials ÷ trials started) × (paying customers ÷ activated trials)
The first term is your in-trial activation rate. The second is how well you convert people who already got value. Almost every conversion tactic on the internet works on the second term. At median activation, the first term loses 62 of every 100 trials before the second term gets a vote.
What is a good free trial to paid conversion rate by trial type?
Without a card, 10% is great. With a card, 25 to 35% is only good. Freemium is good at 3 to 5%.
Trial type | Source and population | Benchmark |
|---|---|---|
Opt-in trial, no card | ChartMogul, 200 B2B software products, surveyed January 2026 | Good 4 to 6%, great 10 to 15% |
Opt-in trial, no card | First Page Sage, 86 SaaS clients (71% B2B), Q1 2022 to Q3 2025 | 18.2% organic, 17.4% paid traffic |
Opt-out trial, card required | ChartMogul, same survey | Good 25 to 35%, great 50 to 60% |
Opt-out trial, card required | First Page Sage, same dataset | 48.8% organic, 51% paid traffic |
Freemium | ChartMogul, same survey | Good 3 to 5%, great 8 to 12% |
Freemium | First Page Sage, same dataset | 2.6% organic, 2.8% paid traffic |
Consumer app trials | RevenueCat, 115,000+ apps, State of Subscription Apps 2026 | Median 25.5% for trials of 4 days or less, 42.5% for 17 to 32 days |
Sources: ChartMogul SaaS Conversion Report (February 2026), First Page Sage (September 2025), RevenueCat (2026).
Two sources, two very different opt-in numbers, and the gap is definitional. ChartMogul counts leads or free signups that become paying customers within six months. First Page Sage aggregates its own agency's clients and counts a conversion as even a single paid month. Pick one yardstick, match its definition, and stop comparing your number against a blend of both.
The RevenueCat row is mobile subscription apps, not B2B SaaS. It belongs here for one reason we will get to: it shows exactly when trials are lost.
FREE GUIDE
The 4 product leaks costing you growth
A short audit guide for founders. Find the four places your product leaks revenue, and what to fix first.
Should you require a credit card for your free trial?
Only if you want a higher rate and can live with fewer signups, because on average you get both.
The card-required number looks like a cheat code. It is a filter. First Page Sage puts organic visitor-to-trial at 8.5% for opt-in trials and 2.5% for opt-out ones. Run 1,000 organic visitors through each:
Opt-in: 85 trials at 18.2% = about 15 paying customers
Opt-out: 25 trials at 48.8% = about 12 paying customers
Arithmetic on First Page Sage's organic averages (September 2025): visitor to trial, then trial to paid.
The card nearly tripled the conversion rate and produced fewer customers. ChartMogul found the same shape one level up: free trials convert slightly better than freemium, and the difference gets wiped out once you account for signup rates. The conversion rate is a ratio. Your bank account is a count.
There is a second catch. On First Page Sage's definition, a card-required trial that auto-renews into one paid month and then cancels counts as a win. That is conversion on paper and churn in practice.
So the card is a pricing decision, not a fix. If your trial converts badly without one, adding it hides the problem behind a smaller denominator.
Why do most free trials fail to convert?
Because trial users who never reach the value moment before the trial ends have nothing to pay for, and at median activation that is most of them.
Median B2B SaaS activation is 38% (Perspective AI, 2026). Put that into the decomposition. If 38% of your trials reach activation and a quarter of those pay, you are converting 9.5%. You can spend a year polishing the paywall, the pricing page and the day-12 reminder email, and all of that work touches the 38%. The other 62% never saw anything worth paying for.
RevenueCat's 2026 report puts a clock on it. For 3-day trials, 55% of cancellations happen on Day 0. RevenueCat's own reading is that the subscriber is won or lost in the first session. That is consumer mobile data, and B2B trials run longer, but the mechanism is the same: the trial length you designed is not the trial length the user gives you.
This is also why trial length is a weaker lever than it looks. RevenueCat's longer trials do convert better (42.5% median against 25.5%), yet the decision still forms early. A longer trial gives a lost user more days to stay lost. It does not show them the value.
ChartMogul's second 2026 report lists faster time to value as a focus area and names the gap underneath it (ChartMogul, March 2026): product activation is owned by the product team 49% of the time, yet few of those teams are accountable for free-to-paid conversion. The people who own the lever are not measured on the number.
What does fixing activation do to trial conversion?
If the paid rate among activated users holds, trial conversion moves in direct proportion to activation.
That is arithmetic, not a promise, and it is the most useful sentence in this post. Here is what it looks like with numbers from a real engagement.
Q.AI came to us with a growing user base and a retention curve nobody could explain. We built a funnel over the new-user path in Amplitude, watched session replays of the users who dropped at the worst step, and redesigned only the screens the data implicated. Activation went from 38% to 67%, onboarding completion rose 68%, and support tickets fell 73%. No new features. Q.AI was later acquired by Forbes.
We did not publish a trial conversion figure for Q.AI, and we will not invent one. But run that activation move through the formula as an illustration. Assume 1,000 trials a month, a paid rate of 20% among activated trials, and $100 a month average revenue per account. All three are assumptions, labeled as such.
Illustrative, 1,000 trials a month | 38% in-trial activation | 67% in-trial activation |
|---|---|---|
Activated trials | 380 | 670 |
Paying customers (20% of activated) | 76 | 134 |
Trial to paid conversion rate | 7.6% | 13.4% |
New MRR from the cohort at $100 ARPA | $7,600 | $13,400 |
Same traffic, same pricing, same paywall. Conversion goes from "good" to "great" on ChartMogul's no-card scale, and each monthly cohort brings in $5,800 more MRR. That is $69,600 a year from one month of trials, before churn, and the same gain lands again every month after.
Compare that with the card-required switch above, which raised the rate and lost three customers per 1,000 visitors.
How do you find where your trial users drop off?
Define the activation event, measure how many trials reach it inside the window, then watch the ones who did not.
The order matters more than the tools.
Write your activation event in one sentence. Not signup, not email verified, not "completed the tour". The first moment a user experiences the core value (Amplitude). If you cannot write it, start with how to define your activation event.
Measure in-trial activation by cohort. Trials started this week, share that reached the event before the trial ended. Compare it with the activation benchmark: median B2B SaaS is 38%.
Split your conversion rate with the formula. If activated trials pay at a healthy rate and the overall number is still low, your problem is the first term, and your pricing page is innocent.
Watch session replays of trials that never activated. Filter to the step where the funnel falls hardest. The reason is usually boring: effort asked before value was shown, or a next step nobody could find.
Change only what the evidence points at, and measure on the same funnel, new trial cohorts against old.
At no step do you touch the trial length or the card. Those are real decisions. Make them after you know how many of your trial users ever saw the product work, because that number decides whether any other change can matter.
WHAT NEXT